2D-Transient Analysis – Explicit Method
The transient behavior of the tubular light bulb was modeled using a two‑dimensional explicit finite‑difference scheme. The same nodal grid and material regions used in the steady‑state analysis were retained, with internal heat generation in the filament region, conduction through the gas and glass, convection and radiation at the exterior glass surface, and a constant‑temperature base. The transient simulation begins from an initial condition in which all nodes are at a uniform temperature representative of a cold bulb prior to energizing the filament.
At each time step, an energy balance is applied to every node to update its temperature based on conduction to neighboring nodes, internal generation (for filament nodes), and convection–radiation losses at exposed surfaces. The update equations follow the standard explicit finite‑difference forms for interior nodes, convective boundaries, and symmetry boundaries described in the transient conduction chapter and are implemented in MATLAB. The time step ΔtΔt was chosen to satisfy the stability requirement for a 2‑D explicit scheme (based on the Fourier number) so that the solution remains stable and physically meaningful over the full heating period.
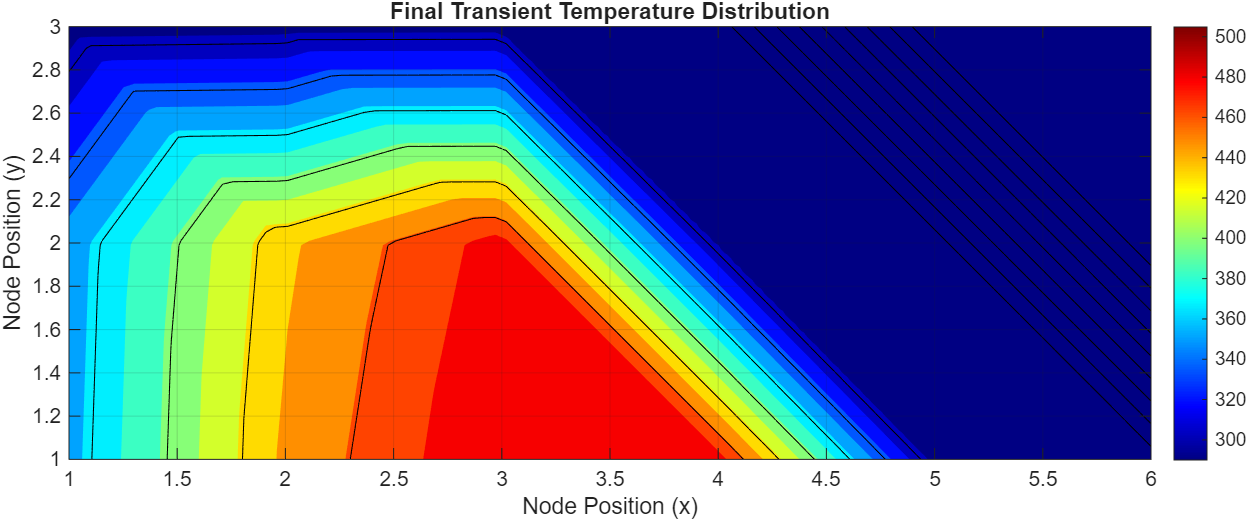
Figure 3 – Transient temperature evolution of the tubular light bulb using the explicit finite‑difference method.
The transient results show that the filament and immediately adjacent nodes heat up rapidly after the filament is energized, creating a hot core region that expands outward as heat conducts into the surrounding gas and glass. The outer glass surface and base respond more slowly due to their distance from the heat generation and the cooling effects of convection, radiation, and the fixed base temperature. Over time, the temperature field approaches the steady‑state distribution obtained in the Part II analysis, with successive time steps showing progressively smaller changes in nodal temperatures. A “near steady‑state” condition was identified when the maximum change in temperature between time steps for all nodes fell below a small threshold, indicating that further heating would not significantly alter the temperature distribution.
Video 2 - Transient Contour Plot