2‑D Steady‑State Temperature Distribution
The thermal behavior of the tubular light bulb was modeled using a two‑dimensional steady‑state finite‑difference heat transfer analysis. The model represents conduction through the filament, air gap, and glass regions; uniform volumetric heat generation within the filament region; combined convection and radiation heat loss from the exterior glass surface; and a constant‑temperature boundary condition at the bulb base. The nodal grid and boundary conditions for this model were defined in the Project Description section, and the corresponding node‑type energy balance equations are provided in Appendix IV‑A.
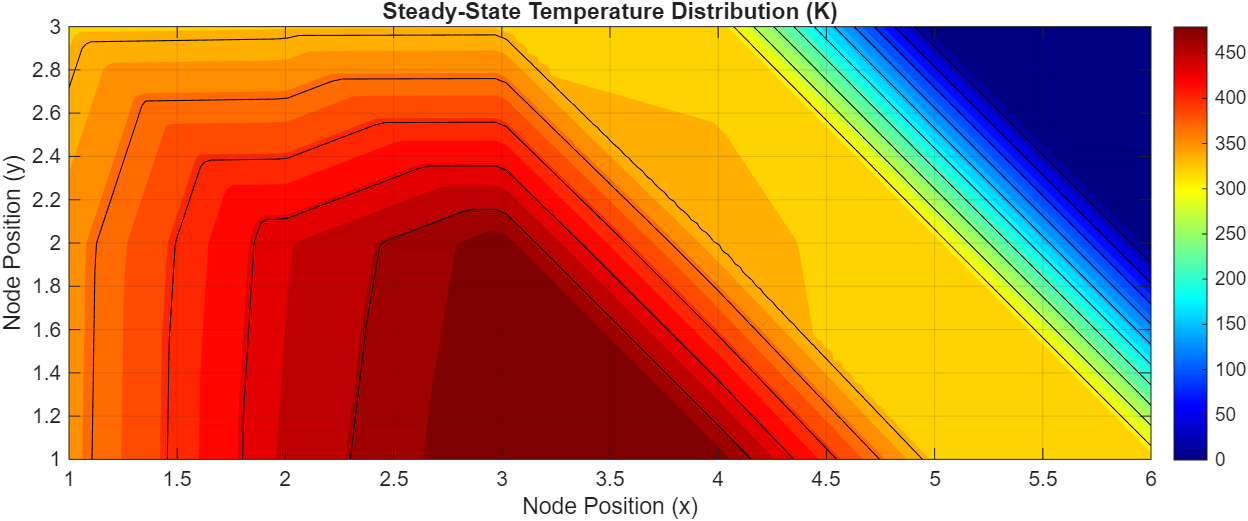
Figure 2 – Steady‑state temperature distribution for the tubular light bulb
The contour plot shows that the highest temperatures occur in the filament region and immediately surrounding nodes, where internal heat generation is applied and heat has not yet spread into the cooler glass and base. Temperatures decrease toward the outer glass surface, where convection and radiation remove energy to the ambient, and toward the base, where the constant‑temperature boundary condition represents heat sinking into the socket. This pattern is physically reasonable: strong internal generation combined with relatively modest external heat transfer coefficients produces a pronounced hot region near the filament and a gradual gradient through the gas and glass envelope.